Trend Tickets · Service lines
Monthly studio revenue by service line
InjectablesLaser & skinWellnessActive members (right axis)
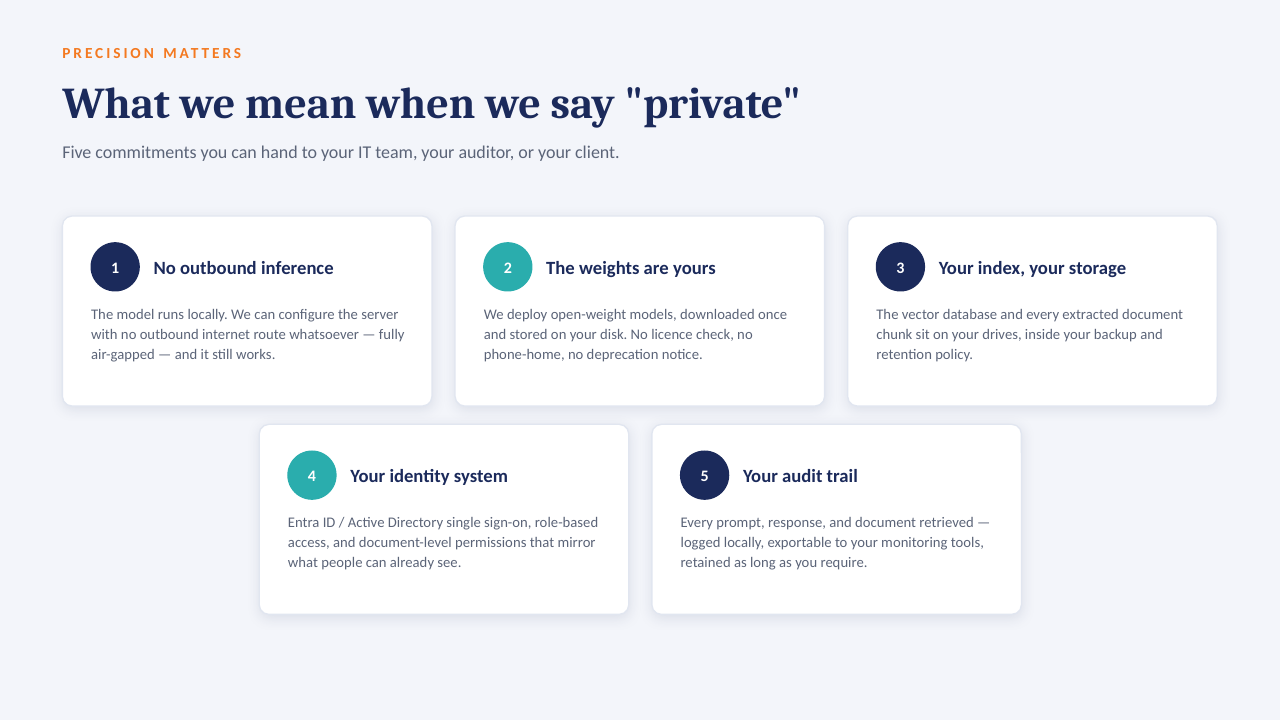
Signature view Studio map
Studio footprint — sized by revenue, colored by rebooking rate
Rebooking rate
< 58%66%> 74%
Share of tickets with a next appointment booked at checkout.
Studio revenue (period)
small → large
Provider productivity Schedules · Tickets
Revenue per provider-hour, by studio
Booked provider hours from the schedule table; bar = revenue ÷ hours. Rose tick = network target.
Membership Memberships · Billing
Member joins vs. cancellations
Service mix Tickets · Line items
Where the ticket dollars go, by region
InjectablesLaser & skinWellness
Under the hood Data model
Four POS tables, one star schema
Whichever practice-management / POS system a studio group runs, the model is the same four facts joined on studio, provider, client and date. That is what makes rebooking, member churn and revenue-per-hour live on the same page.
TicketsClosed sales, line items, tips, product vs service
ticket_id · studio · provider · client · svc_line · net_$
AppointmentsBooked, arrived, no-show, and the next-visit flag that drives rebooking
appt_id · client · booked_at · status · next_appt
MembershipsTier, start, cancel, monthly billing events
member_id · tier · start · cancel · bill_$
Provider schedulesScheduled vs booked hours per provider per day
provider · studio · date · sched_hrs · booked_hrs
1 Anchor: ovme.com cites 28 studios across 16 states and 50,000+ clients; the 28 studios plotted are the ones named on ovme.com/locations (Sept 2026). Studio names, regions and membership tier names (Maintain, Reset, Transform) are taken from ovme.com. All revenue, membership, provider-hour and rebooking figures are illustrative demonstration data generated for this concept and are not OVME's results.